
TL;DR
My old Lenovo Ideapad’s HDD gave up. The x86 node was gone. So instead of mourning it, I rebuilt the cluster from scratch—this time with just the two Pis, monitoring set up before anything else, and a proper Helm-based setup instead of raw manifests for everything. This post is a step-by-step tutorial for anyone who wants to replicate it.
Multi-Arch K3s Home Lab Series:
- Part 1: Why and Hardware – Why I built the cluster and the hardware lineup.
- Part 2: Networking, Storage, and Apps – Networking, storage, and apps.
- Part 3: Failures, Lessons, and What’s Next – What broke, what I learned, and future plans.
- Part 4: Rebuilding from Scratch (The Right Way) (you are here)
The Laptop Died. Time to Rebuild.
In Part 3, I talked about lessons learned and things I’d do differently. I didn’t expect to get a chance to apply them so soon.
The Lenovo Ideapad’s HDD corrupted. One morning the node just wasn’t there—and after some investigation, it was clear the disk was gone. No recovering it gracefully.
So now I had:
- A Raspberry Pi 4B (8 GB) — the master.
- A Raspberry Pi 400 (4 GB) — the worker.
- Zero x86 nodes.
And honestly? I decided this was a good thing. If I was going to rebuild anyway, I was going to do it properly this time—with documentation, monitoring from day one, and Helm charts where they make sense.
This post is that rebuild, written as a tutorial you can follow on your own Pis. I’m not going to skip the annoying parts.
Hardware and Prerequisites
For this guide you’ll need:
- At least one Raspberry Pi (Pi 4B or newer recommended) with a microSD card or SSD running Raspberry Pi OS (64-bit).
- The Pi on your local network, ideally via ethernet for stability.
- A machine (your laptop or desktop) to SSH from.
A second Pi or any Linux machine on the same network is optional—you can add it as a worker node later, and I’ll cover exactly how in the K3s install step.
My exact setup:
- Node 1 (Master): Raspberry Pi 4B, 8 GB RAM, 128 GB SSD via USB boot.
- Node 2 (Worker): Raspberry Pi 400, 4 GB RAM, SD card.
Step 1: Base Pi Setup
Do this on every node unless noted otherwise.
Initial config
sudo raspi-config
sudo apt update && sudo apt upgrade -y
sudo apt install -y tmux btop tree
raspi-config is worth going through properly—set your hostname, locale, and make sure SSH is enabled. I name my nodes something obvious: pi-master and pi-worker.
Set a static IP over ethernet
Relying on DHCP for cluster nodes is asking for trouble. Give each Pi a fixed IP so K3s always knows where to find the master.
nmcli con mod "Wired connection 1" \
  ipv4.addresses 192.168.1.50/24 \
  ipv4.gateway 192.168.1.1 \
  ipv4.dns "8.8.8.8 8.8.4.4" \
  ipv4.method manual

nmcli con down "Wired connection 1"
nmcli con up "Wired connection 1"
Replace 192.168.1.50 with whatever IP fits your network. I use 192.168.1.50 for the master and 192.168.1.51 for the worker.
Enable cgroups (critical for K3s)
K3s needs memory cgroups to manage containers properly. Without this, your agent nodes will silently fail to schedule pods.
echo -n "cgroup_memory=1 cgroup_enable=memory" | sudo tee -a /boot/firmware/cmdline.txt
⚠️ Important:
tee -aappends to the file, but make sure there is no newline at the end of the existingcmdline.txtbefore you run this. The bootloader reads this as a single line—a stray newline will break boot. Open the file first withcat /boot/firmware/cmdline.txtand confirm it’s one line.
Reboot after this:
sudo reboot
Set up SSH keys
Do this from your local machine (not the Pi), once for each node you have:
ssh-keygen -t ed25519 -C "your-comment-here"
ssh-copy-id -i ~/.ssh/id_ed25519 [email protected]
# If you have a second node:
# ssh-copy-id -i ~/.ssh/id_ed25519 [email protected]
Then lock down the permissions on the Pi:
chmod 700 ~/.ssh
chmod 600 ~/.ssh/authorized_keys
Step 2: Install K3s
On the master node
curl -sfL https://get.k3s.io | sh -
That’s it for a single-node setup. Everything else in this guide works exactly the same whether you have one node or three—K3s handles it fine either way.
Set up kubectl for your user
By default, K3s puts the kubeconfig in a root-owned file. Let’s fix that:
mkdir -p ~/.kube
sudo cp /etc/rancher/k3s/k3s.yaml ~/.kube/config
sudo chown $(whoami):$(whoami) ~/.kube/config
echo 'export KUBECONFIG=~/.kube/config' >> ~/.bashrc
source ~/.bashrc
Verify everything looks right:
kubectl get nodes
You should see your master node with a Ready status.
🖥️ Got a second machine? Add it as a worker node.
If you have another Pi (or any Linux machine) on the same network, you can join it to the cluster as a worker. First, grab the node token from the master:
sudo cat /var/lib/rancher/k3s/server/node-tokenThen on the worker machine, run:
curl -sfL https://get.k3s.io | \
  K3S_URL=https://192.168.1.50:6443 \
  K3S_TOKEN=<your-node-token> sh -
Replace
192.168.1.50with your master’s IP and<your-node-token>with what you copied. After a minute,kubectl get nodeson the master should show both nodes asReady.The rest of this guide works identically—Longhorn and the monitoring stack will automatically spread across however many nodes you have.
Step 3: Install Helm and k9s
Before we get into storage and monitoring, let’s install the tools we’ll need. This time around I’m using Helm for anything that has a maintained chart—it’s much cleaner than managing raw YAML for complex stacks like the Prometheus suite.
Helm
sudo apt-get install -y curl gpg apt-transport-https
curl -fsSL https://packages.buildkite.com/helm-linux/helm-debian/gpgkey \
  | gpg --dearmor \
  | sudo tee /usr/share/keyrings/helm.gpg > /dev/null
echo "deb [signed-by=/usr/share/keyrings/helm.gpg] https://packages.buildkite.com/helm-linux/helm-debian/any/ any main" \
  | sudo tee /etc/apt/sources.list.d/helm-stable-debian.list
sudo apt-get update && sudo apt-get install -y helm
Verify:
helm version
k9s
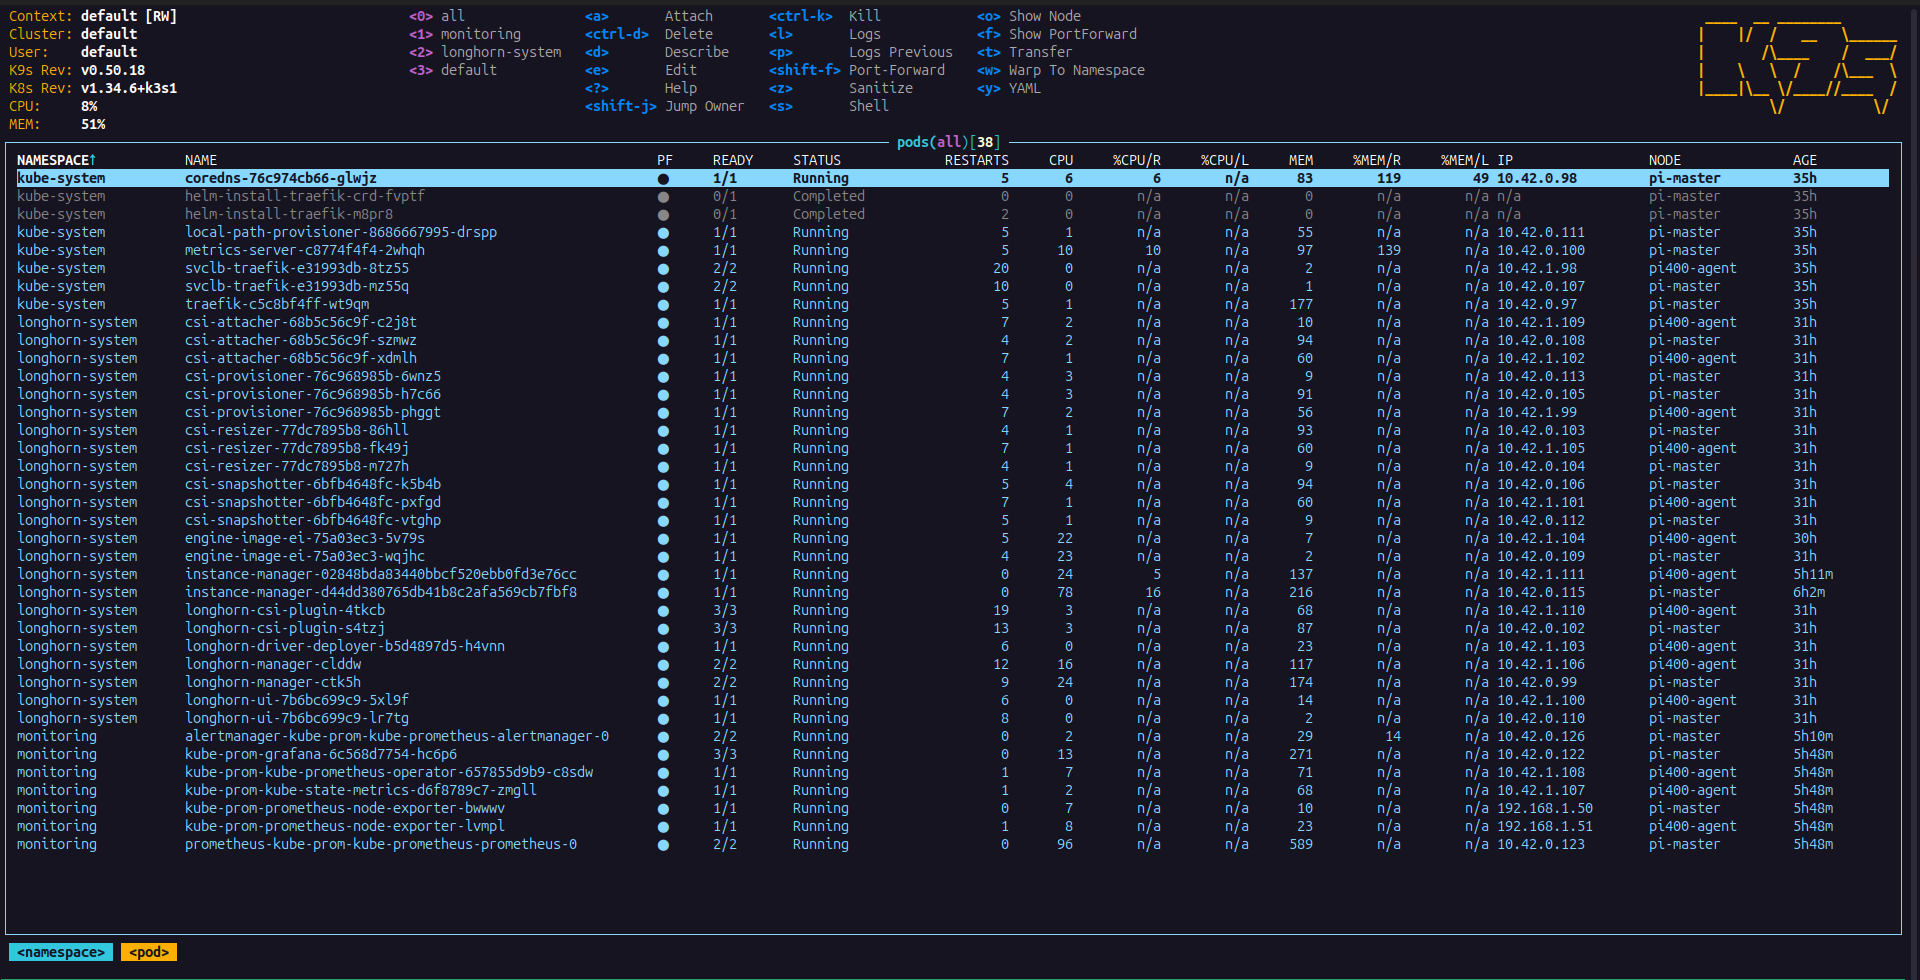
k9s is a terminal-based Kubernetes dashboard. Genuinely one of the best ways to navigate a cluster without having to type kubectl get pods -A every 30 seconds.
wget https://github.com/derailed/k9s/releases/latest/download/k9s_linux_arm64.deb
sudo apt install ./k9s_linux_arm64.deb
rm k9s_linux_arm64.deb
Launch it with just k9s. From here on, whenever I say “watch the pods”, this is where I’m doing it. Press 0 to see all namespaces at once, navigate with arrow keys, and hit l on any pod to tail its logs in real time.
Step 4: Storage with Longhorn
Storage is one of the reasons to use K3s over plain Docker. Longhorn gives you proper PersistentVolumeClaims that survive pod restarts and can replicate data across nodes.
Prerequisites on every node
sudo apt install -y open-iscsi nfs-common cryptsetup dmsetup
open-iscsi– required by Longhorn for block storage.nfs-common– needed for ReadWriteMany (RWX) volumes.cryptsetup+dmsetup– for Longhorn’s encryption features.
Create the data directory on every node
This is the gotcha that tripped me up this time too. Longhorn expects a directory at /data/longhorn to exist before it starts. If it doesn’t, the pod will start failing its liveness probe immediately:
Warning Unhealthy kubelet Liveness probe failed: sh: /data/longhorn: No such file or directory
Fix it on every node before deploying:
sudo mkdir -p /data/longhorn
Deploy Longhorn
kubectl apply -f https://raw.githubusercontent.com/longhorn/longhorn/v1.11.1/deploy/longhorn.yaml
This will take a few minutes. Use k9s to watch it come up—switch to the longhorn-system namespace by pressing : and typing the namespace name, or just hit 0 to watch everything at once.
Wait until everything is Running before moving on.
Expose the Longhorn UI via Traefik
Longhorn ships with a dashboard. To reach it from your browser, apply a Middleware and an Ingress. The official Longhorn docs have a Traefik-specific section here: https://longhorn.io/docs/1.11.1/deploy/accessing-the-ui/longhorn-ingress-traefik/
Make Longhorn the default StorageClass
K3s installs local-path as the default storage class. We want Longhorn to take over that role:
# Demote local-path
kubectl patch storageclass local-path \
  -p '{"metadata":{"annotations":{"storageclass.kubernetes.io/is-default-class":"false"}}}'

# Promote longhorn
kubectl patch storageclass longhorn \
  -p '{"metadata":{"annotations":{"storageclass.kubernetes.io/is-default-class":"true"}}}'
Confirm:
kubectl get storageclass
longhorn should now show (default).
Step 5: Monitoring — The Thing I Set Up First This Time
In Part 3, I admitted that monitoring was an afterthought. This time, it went in before any of my apps. And honestly, it made the rest of the setup a lot less stressful—I could actually see what was happening on the cluster as I configured things.
The kube-prometheus-stack Helm chart bundles everything you want in one go:
- Prometheus – scrapes and stores metrics.
- Grafana – dashboards and visualization.
- Node Exporter – exposes hardware and OS metrics from each node.
- Alertmanager – routes alerts when something goes wrong.
Create the monitoring namespace
kubectl apply -f - <<EOF
apiVersion: v1
kind: Namespace
metadata:
  name: monitoring
EOF
Or if you prefer a file-based approach, save that as namespace.yaml and kubectl apply -f namespace.yaml.
Add the Helm repos
helm repo add prometheus-community https://prometheus-community.github.io/helm-charts
helm repo add grafana https://grafana.github.io/helm-charts
helm repo update
Apply your secrets
Before installing, create a secret with your Grafana admin credentials so they don’t end up hardcoded in a values file:
kubectl apply -f k3s/Secrets/monitoring-secrets.yaml -n monitoring
Your monitoring-secrets.yaml should look something like this (base64-encode your values):
apiVersion: v1
kind: Secret
metadata:
  name: monitoring-secrets
  namespace: monitoring
type: Opaque
data:
  grafana-admin-password: <base64-encoded-password>
Install the Prometheus stack
helm install kube-prom prometheus-community/kube-prometheus-stack \
  --namespace monitoring \
  --version 83.6.0 \
  --values k3s/Monitoring/prometheus-stack.yaml
My full prometheus-stack.yaml is in the k3s_cluster repo. The key things it configures:
- Persistent storage for Prometheus and Grafana, pointed at Longhorn so data survives pod restarts.
- Grafana ingress via Traefik so you can reach the dashboard at a proper hostname.
- Grafana admin credentials pulled from the Kubernetes secret you applied earlier (not hardcoded in the values file).
- Alertmanager receivers if you want alerts routed somewhere.
Watch the monitoring pods come up in k9s—switch to the monitoring namespace and wait for everything to go green.
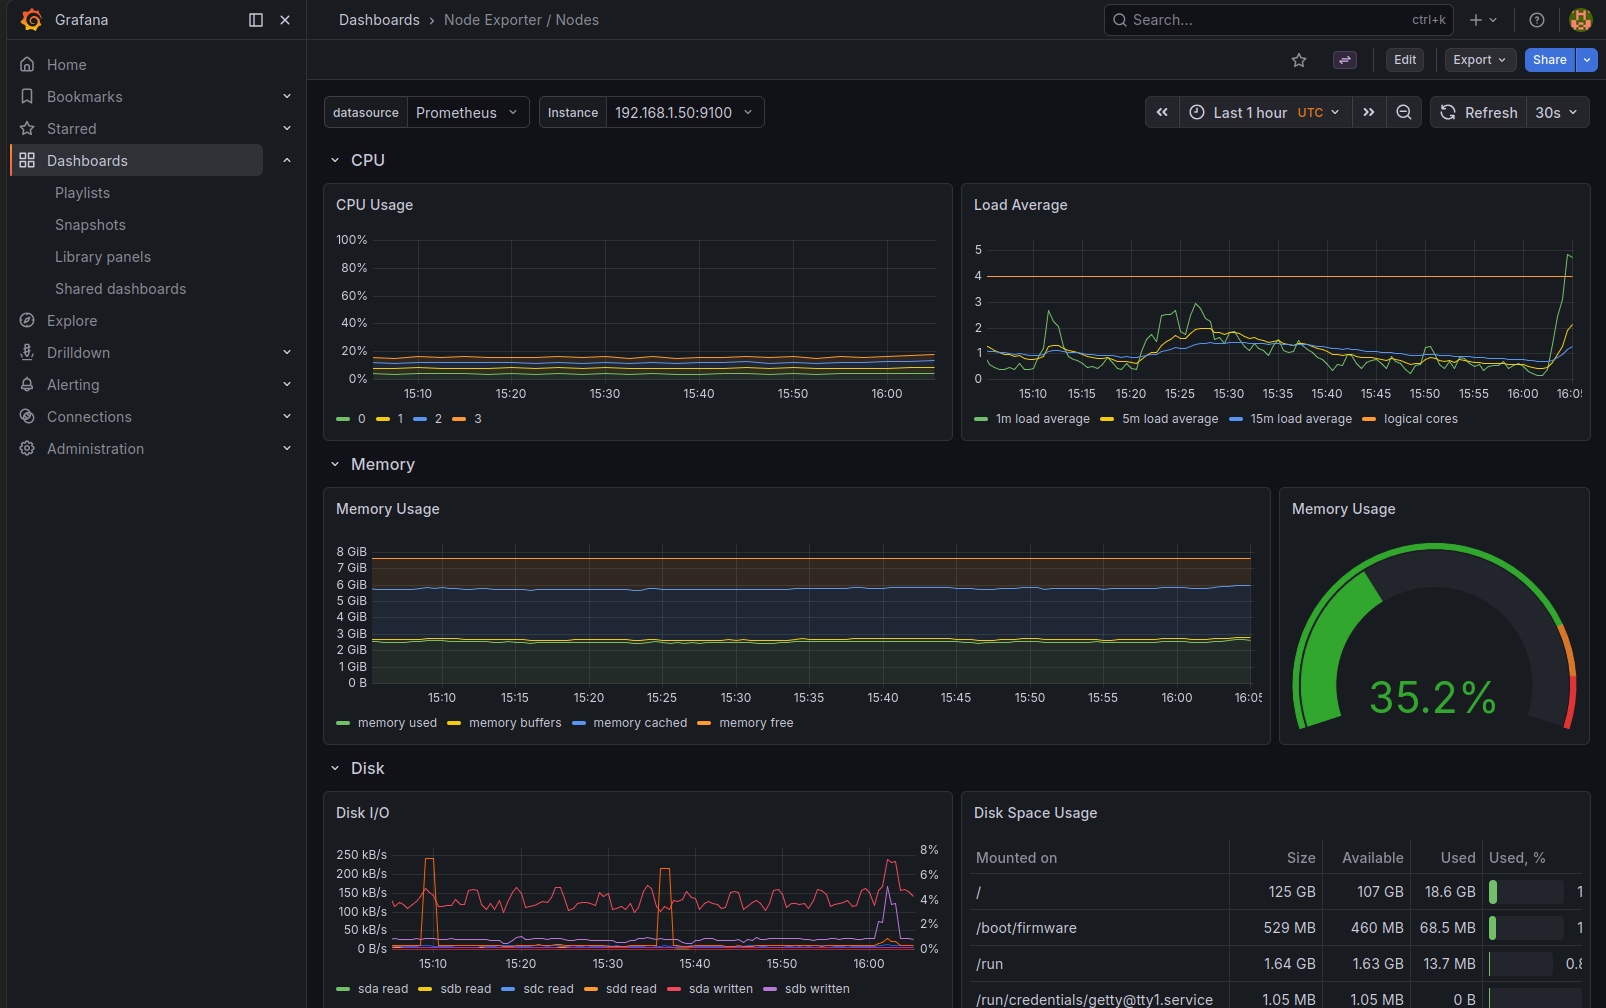
Once Grafana is running, hit its ingress URL and log in. The stack ships pre-loaded with dashboards for node metrics, pod resource usage, and Kubernetes cluster health—you get a lot out of the box without any extra configuration.
💡 Why Helm here? The Prometheus stack involves a large number of CRDs, RBAC rules, service accounts, and inter-connected resources. Trying to maintain all of that as raw YAML would be a nightmare. A single
helm upgradehandles everything when you need to update versions.
Step 6: Log Aggregation with Loki and Alloy
Grafana dashboards told me what the cluster was doing. Loki tells me why something broke. The two go together—once Loki is wired up, you can jump from a spike in an error-rate graph straight into the relevant log lines without leaving Grafana.
The setup has two pieces:
- Loki – stores and indexes logs.
- Alloy – Grafana’s agent that collects logs from every pod and ships them to Loki. (Alloy is the modern replacement for Promtail.)
Install Loki
helm install loki grafana/loki \
  --namespace monitoring \
  --version 6.55.0 \
  --values k3s/Monitoring/loki-values.yaml
The loki-values.yaml configures Loki in single-binary mode (appropriate for a home lab), with Longhorn-backed persistent storage so log data survives pod restarts.
Install Alloy
helm install alloy grafana/alloy \
  --namespace monitoring \
  --version 1.7.0 \
  --values k3s/Monitoring/alloy-values.yaml
Alloy runs as a DaemonSet—one pod per node—so it picks up logs from every container regardless of which node it lands on. The alloy-values.yaml configures it to tail pod logs from the Kubernetes API and forward them to the Loki service inside the cluster.
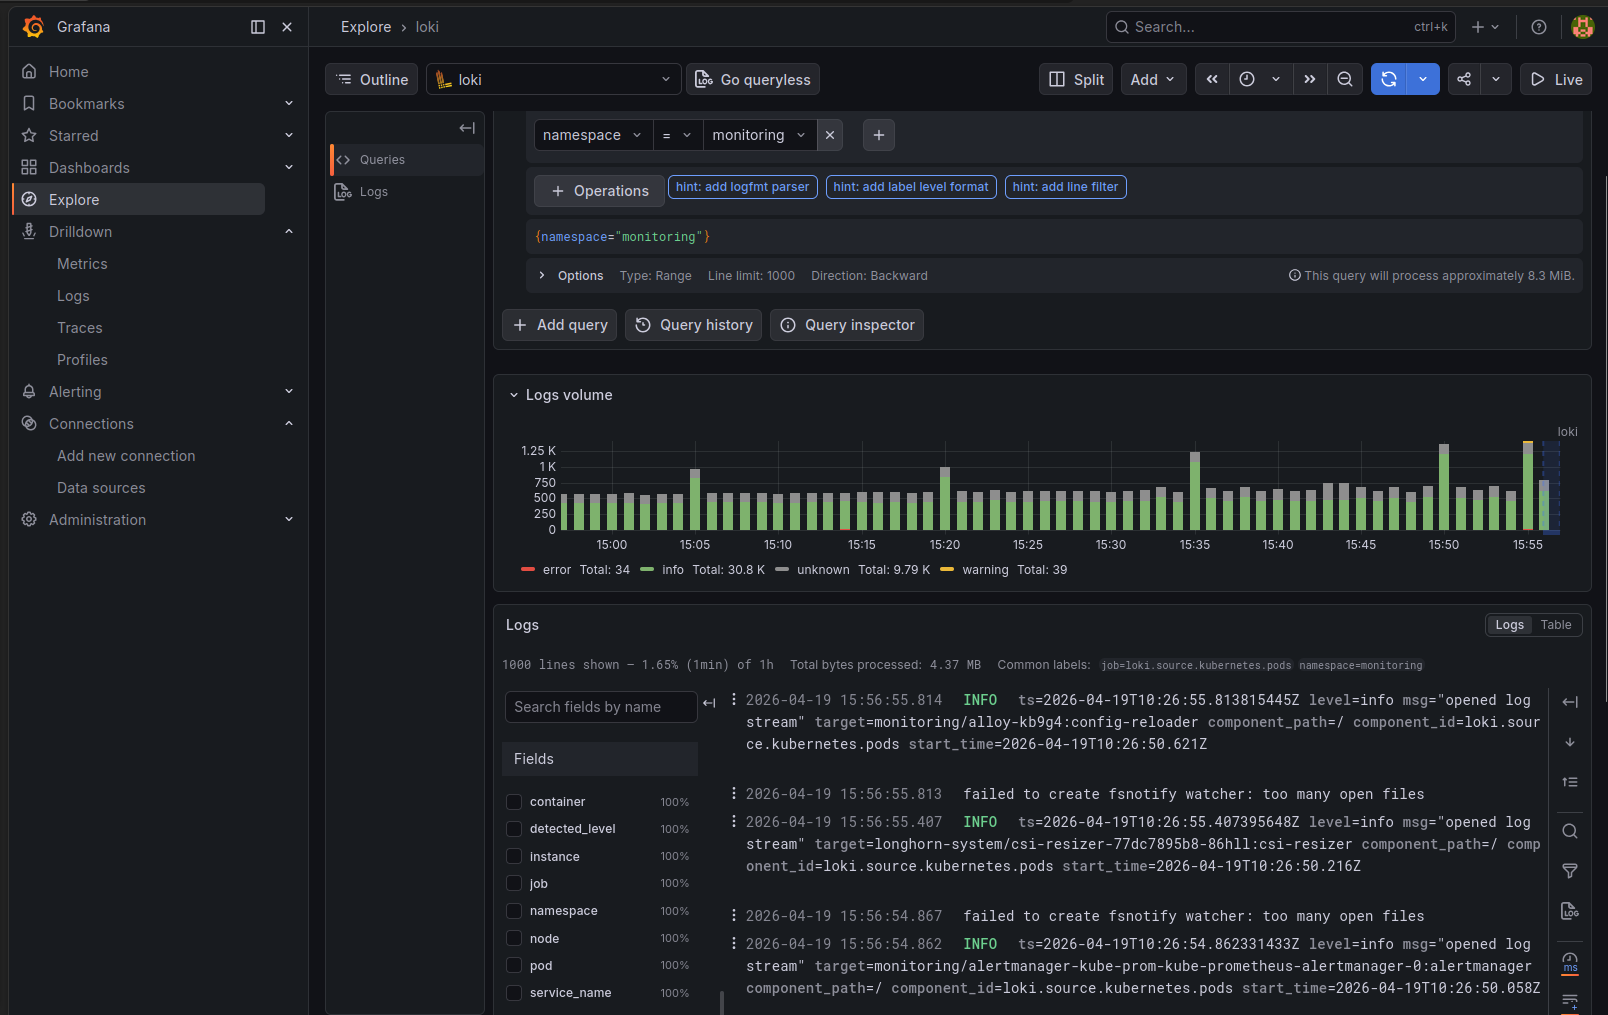
Watch both come up in k9s before moving on. Once they’re green, go into Grafana → Explore, select the Loki datasource, and you should be able to query logs from any namespace immediately.
💡 Why Alloy instead of Promtail? Promtail still works, but Grafana is consolidating their agent ecosystem around Alloy. Starting with Alloy means less migration work later and access to a broader set of pipeline components if you want to filter or transform logs before they hit Loki.
Step 7: Uptime Monitoring with Uptime Kuma
Prometheus and Grafana are great for deep metrics. Uptime Kuma solves a different problem: a clean status page that tells you at a glance whether your services are up, and sends you a notification when they’re not.
Install Uptime Kuma
helm repo add uptime-kuma https://dirsigler.github.io/uptime-kuma-helm
helm repo update

helm install uptime-kuma uptime-kuma/uptime-kuma \
  --namespace monitoring \
  --version 4.0.0 \
  --values k3s/Monitoring/uptimekuma-values.yaml
The uptimekuma-values.yaml is in the repo if you want to see exactly how it’s configured—it sets up a Longhorn-backed PVC and a Traefik ingress so the dashboard is reachable by hostname.
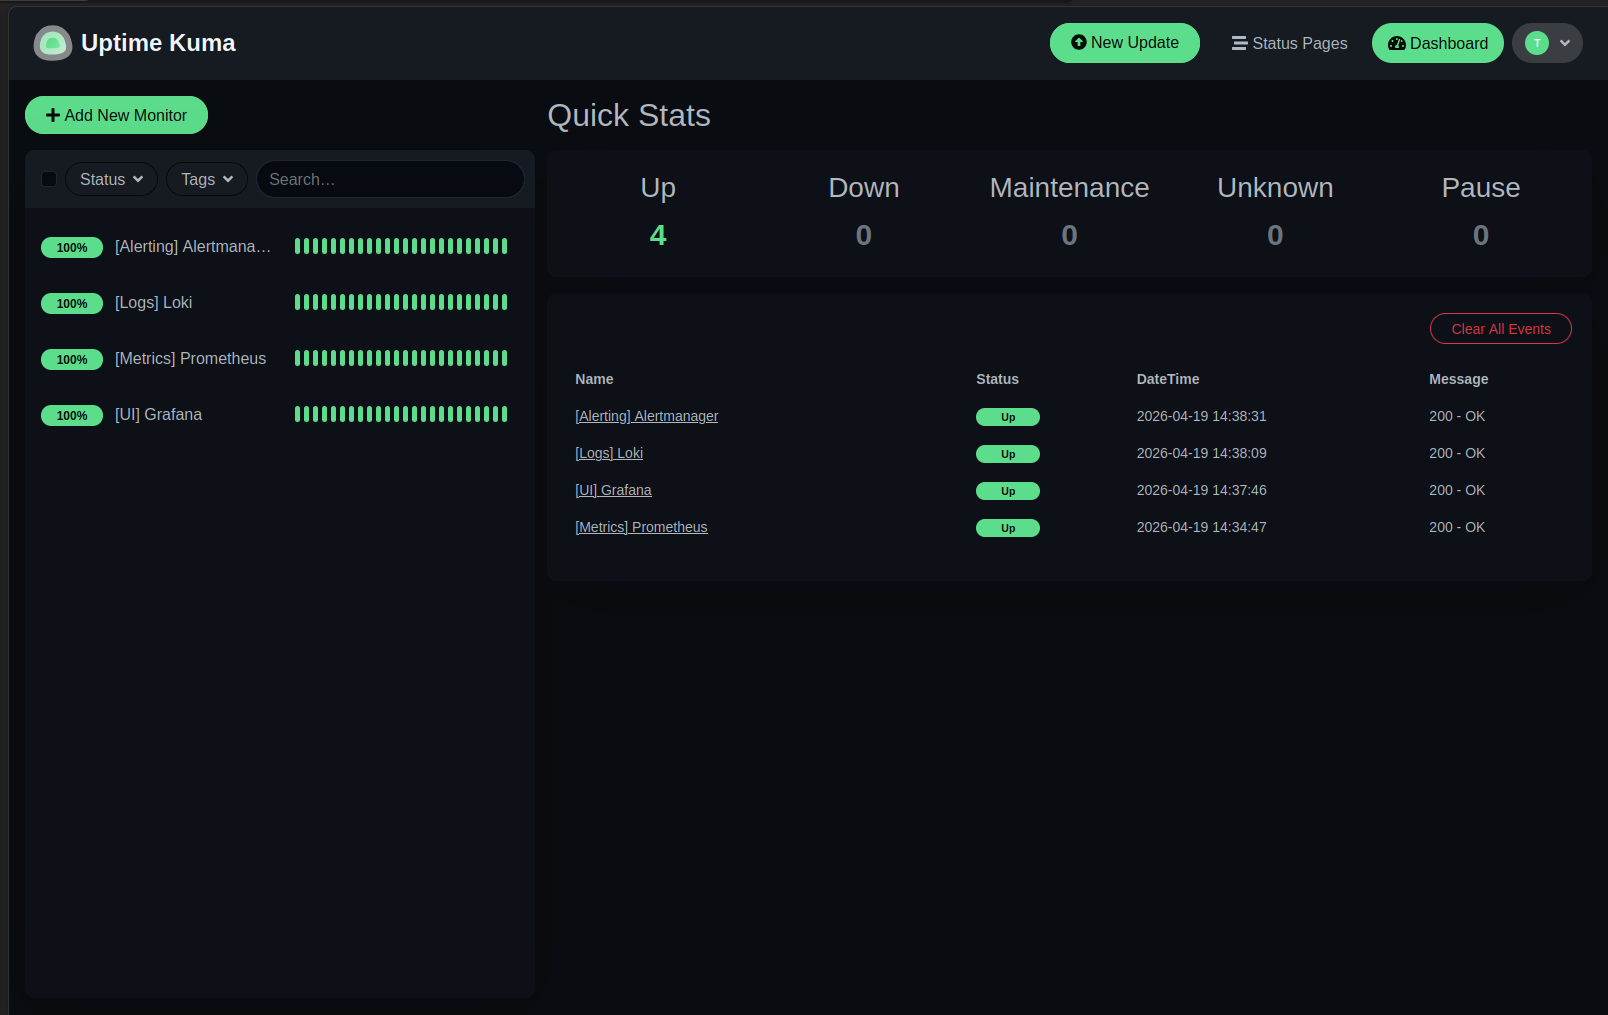
Configure monitors
Once Uptime Kuma is running, set up HTTP monitors for each component of the observability stack itself. Using internal cluster DNS (*.svc.cluster.local) means Uptime Kuma checks the actual service endpoints, not just the ingress—so a routing failure won’t give you a false positive.
Prometheus
- Name:
[Metrics] Prometheus - URL:
http://kube-prom-kube-prometheus-prometheus.monitoring.svc.cluster.local:9090/-/ready
Grafana
- Name:
[UI] Grafana (internal) - URL:
http://kube-prom-grafana.monitoring.svc.cluster.local
Loki
- Name:
[Logs] Loki - URL:
http://loki.monitoring.svc.cluster.local:3100/ready
Alertmanager
- Name:
[Alerting] Alertmanager - URL:
http://kube-prom-kube-prometheus-alertmanager.monitoring.svc.cluster.local:9093/-/ready
With these in place, the monitoring stack is monitoring itself. If Prometheus goes down, Uptime Kuma will tell you before you notice it’s gone.
Quick Reference: Order of Operations
If you’re following along and want the short version, here’s the sequence that worked for me:
- Flash OS, set hostname, enable SSH.
- Set a static IP on the master node.
- Enable cgroups, reboot.
- Set up SSH keys from your local machine.
- Install K3s on the master.
- (Optional) Join additional machines as worker nodes.
- Configure
kubectlon the master. - Install Helm and k9s.
- Install Longhorn prerequisites, create
/data/longhornon every node, deploy Longhorn. - Set Longhorn as the default StorageClass.
- Install
kube-prometheus-stackvia Helm. - Install Loki and Alloy via Helm.
- Install Uptime Kuma and configure internal service monitors.
- Deploy your apps.
The order matters—specifically, get storage working before monitoring, and get monitoring working before apps. That way if an app misbehaves, you can actually see why.
References
- K3s – Lightweight Kubernetes for edge and home labs.
- Longhorn – Cloud-native distributed block storage.
- kube-prometheus-stack – Helm chart for the full Prometheus observability stack.
- Loki – Log aggregation system by Grafana Labs.
- Alloy – Grafana’s OpenTelemetry-compatible agent for collecting and forwarding telemetry.
- Uptime Kuma – Self-hosted uptime monitoring and status pages.
- Helm – Kubernetes package manager.
- k9s – Terminal UI for Kubernetes.
- Traefik – Ingress controller bundled with K3s.
- Raspberry Pi OS – OS for the Pis.
The cluster config lives here if you want to see the actual manifests: